OpenClaw Stock Analysis
The openclaw-stock image focuses on stock market analysis, covering A-shares, Hong Kong stocks, and US stocks. It provides a complete toolkit from market overview to individual stock technical analysis.
Included Skills
1. market-overview — Market Overview
Quickly grasp the overall market conditions and trending sectors for the day.
What it can do:
Major index quotes: Get price changes and trading data for the four major indices (SSE, SZSE, ChiNext, STAR) in one go
Industry sector rankings: View the top-gaining and top-losing industry sectors to assess capital flow
Concept sector rankings: Discover trending concept themes of the day (e.g., AI, semiconductors, new energy)
Comprehensive analysis report: Generate a structured daily market report, ideal for a quick morning review
Example commands:
Show me today's market overview
How's the market doing today? Any hot sectors?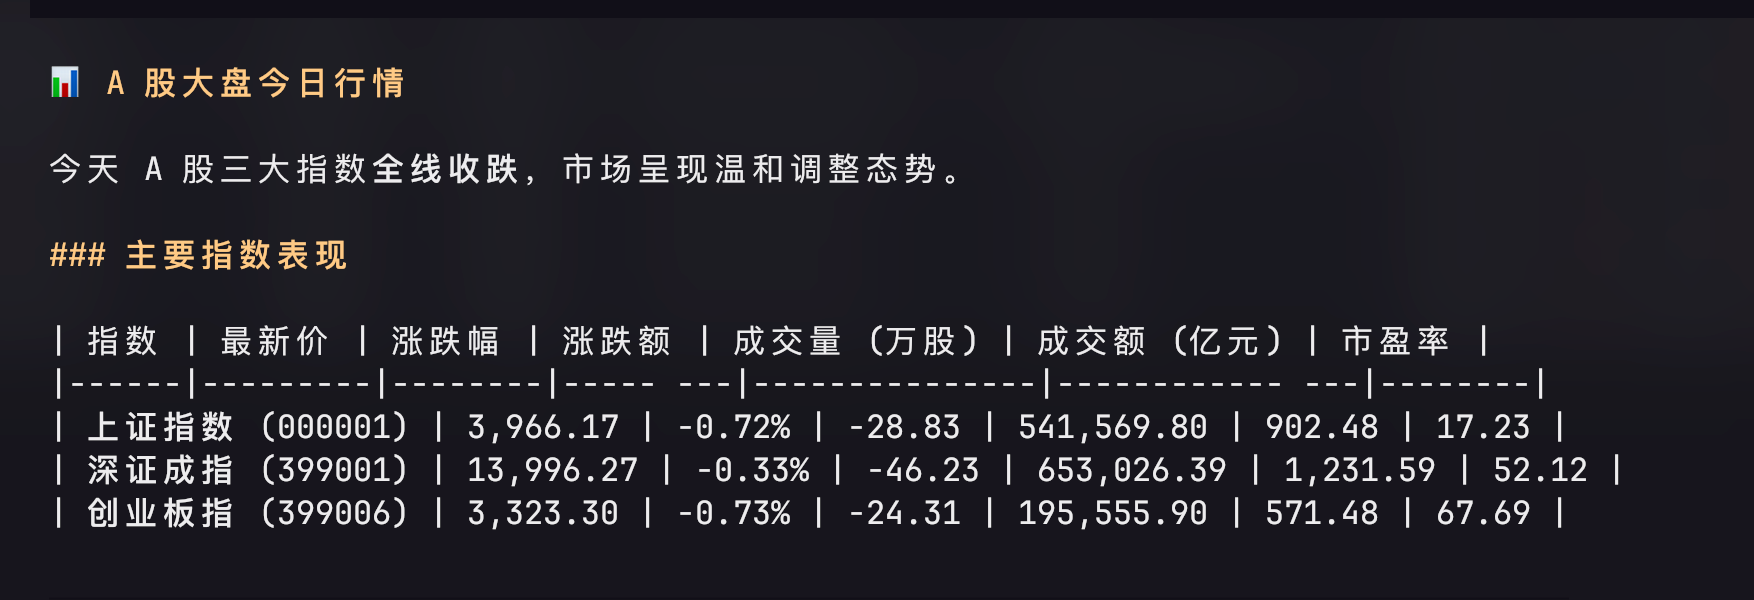
2. realtime-monitor — Watchlist Real-Time Monitor
Track real-time prices of specified stocks with portfolio profit/loss calculation.
What it can do:
Real-time quotes: Query current price, price change, and volume by stock code or name
Multi-stock monitoring: Monitor multiple stocks at once with a unified format output
Portfolio P&L mode: Enter your cost basis and quantity to calculate real-time unrealized gains/losses
Anomaly detection: Identify unusual price movements and volume spikes
Example commands:
Check the real-time quotes for Moutai, BYD, and CATL
Monitor my watchlist: 600519, 002594, 300750
I hold 100 shares of Moutai at a cost of 1800 CNY, how much have I lost?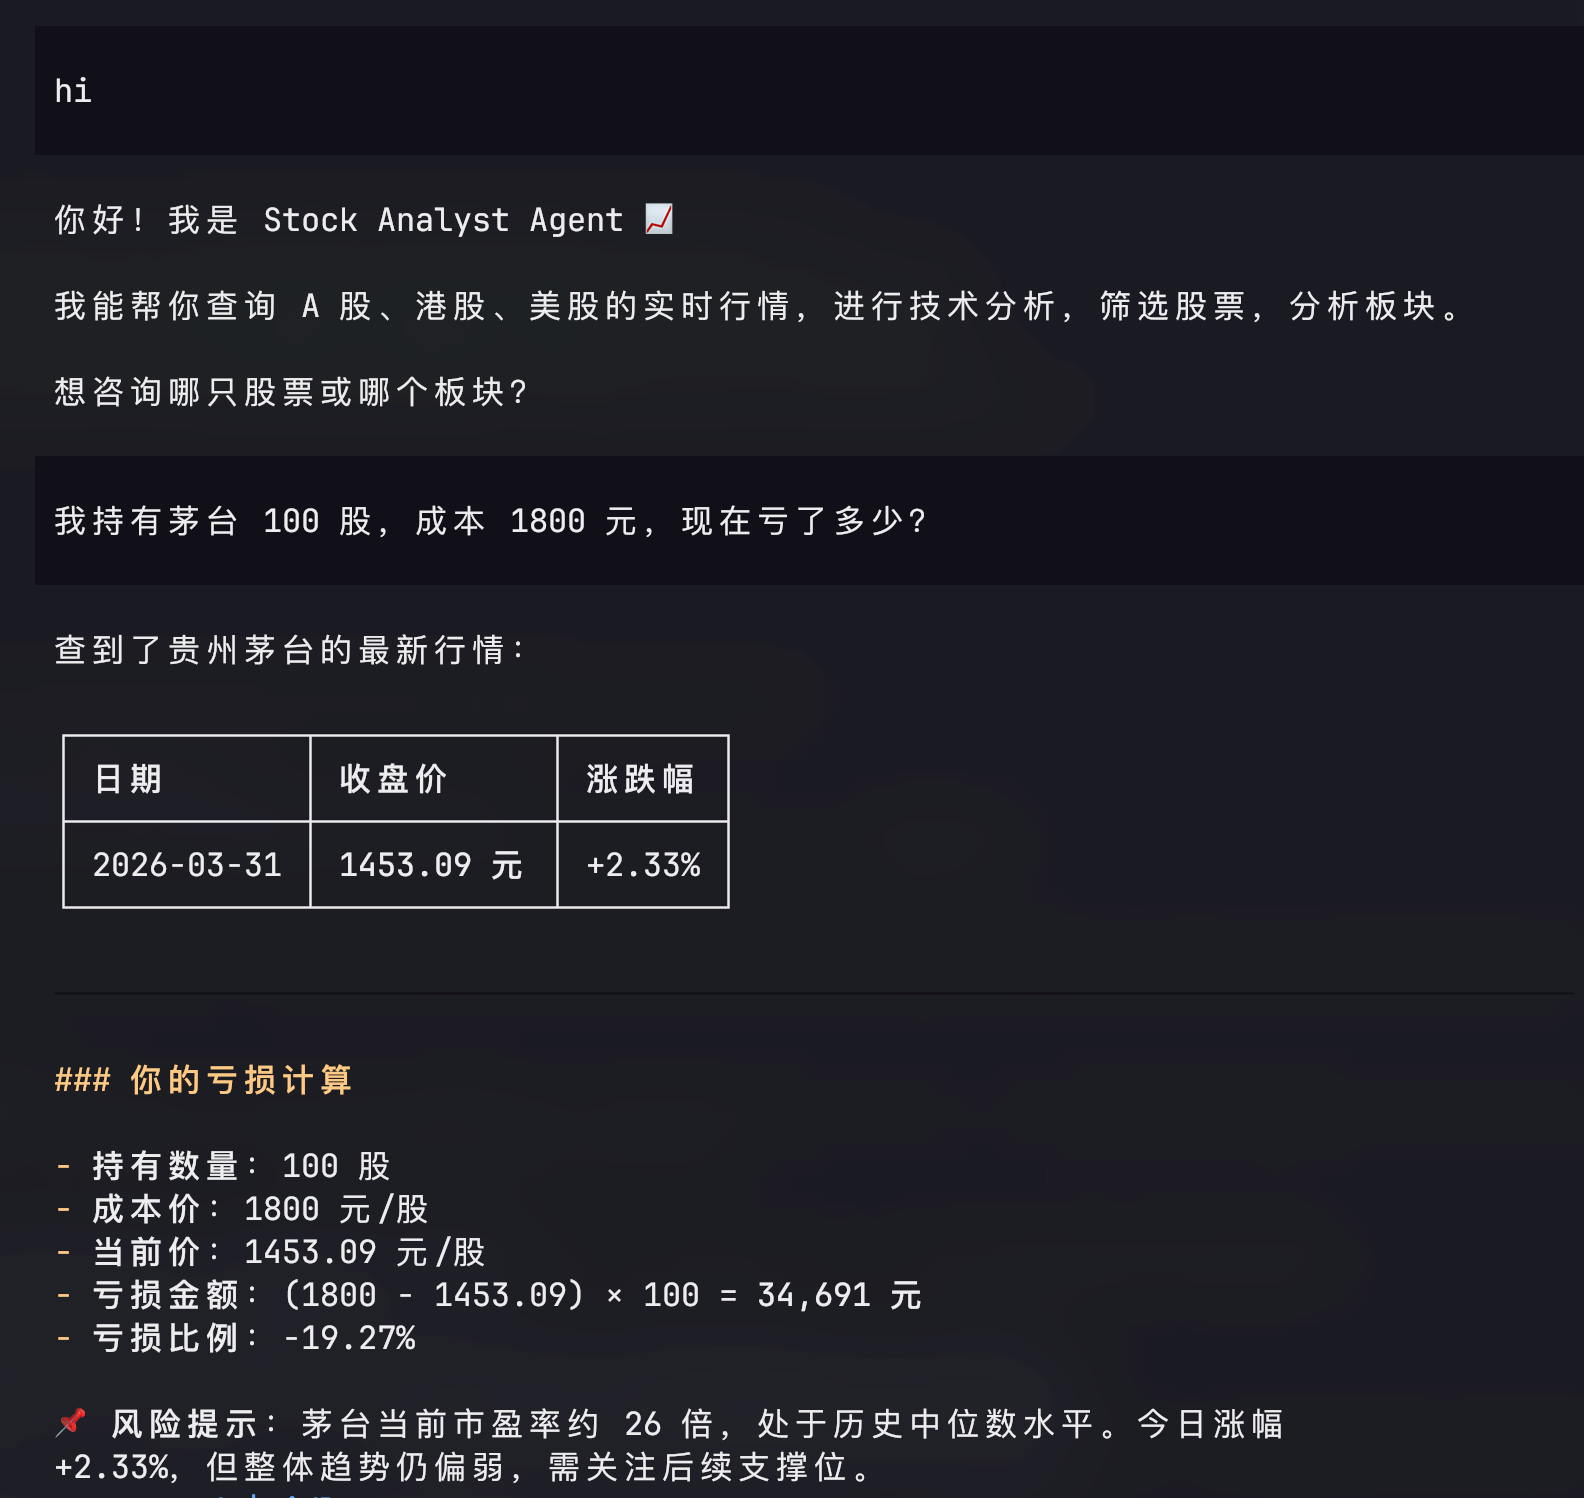
3. stock-analyst — Individual Stock Technical Analysis
Perform in-depth technical analysis on individual stocks, suitable for short-to-medium-term trading reference.
What it can do:
Market data retrieval:
- Real-time price, price change, turnover rate, volume ratio
Technical indicator analysis (auto-calculated):
| Indicator | Purpose |
|---|---|
| MA (Moving Average) | Determine trend direction and support/resistance levels |
| MACD | Identify trend reversals and buy/sell signals |
| KDJ | Overbought/oversold assessment, short-term entry timing |
| RSI | Relative strength, avoid chasing highs and selling lows |
| BOLL (Bollinger Bands) | Volatility range prediction, breakout detection |
Analysis report contents:
Current trend direction (uptrend / sideways / downtrend)
Key support and resistance levels
Comprehensive multi-indicator assessment
Trading recommendation reference
Example commands:
Analyze the technical aspects of BYD (002594)
What's the current trend for Moutai? Any buy signals?
Analyze NVIDIA's recent candlestick patterns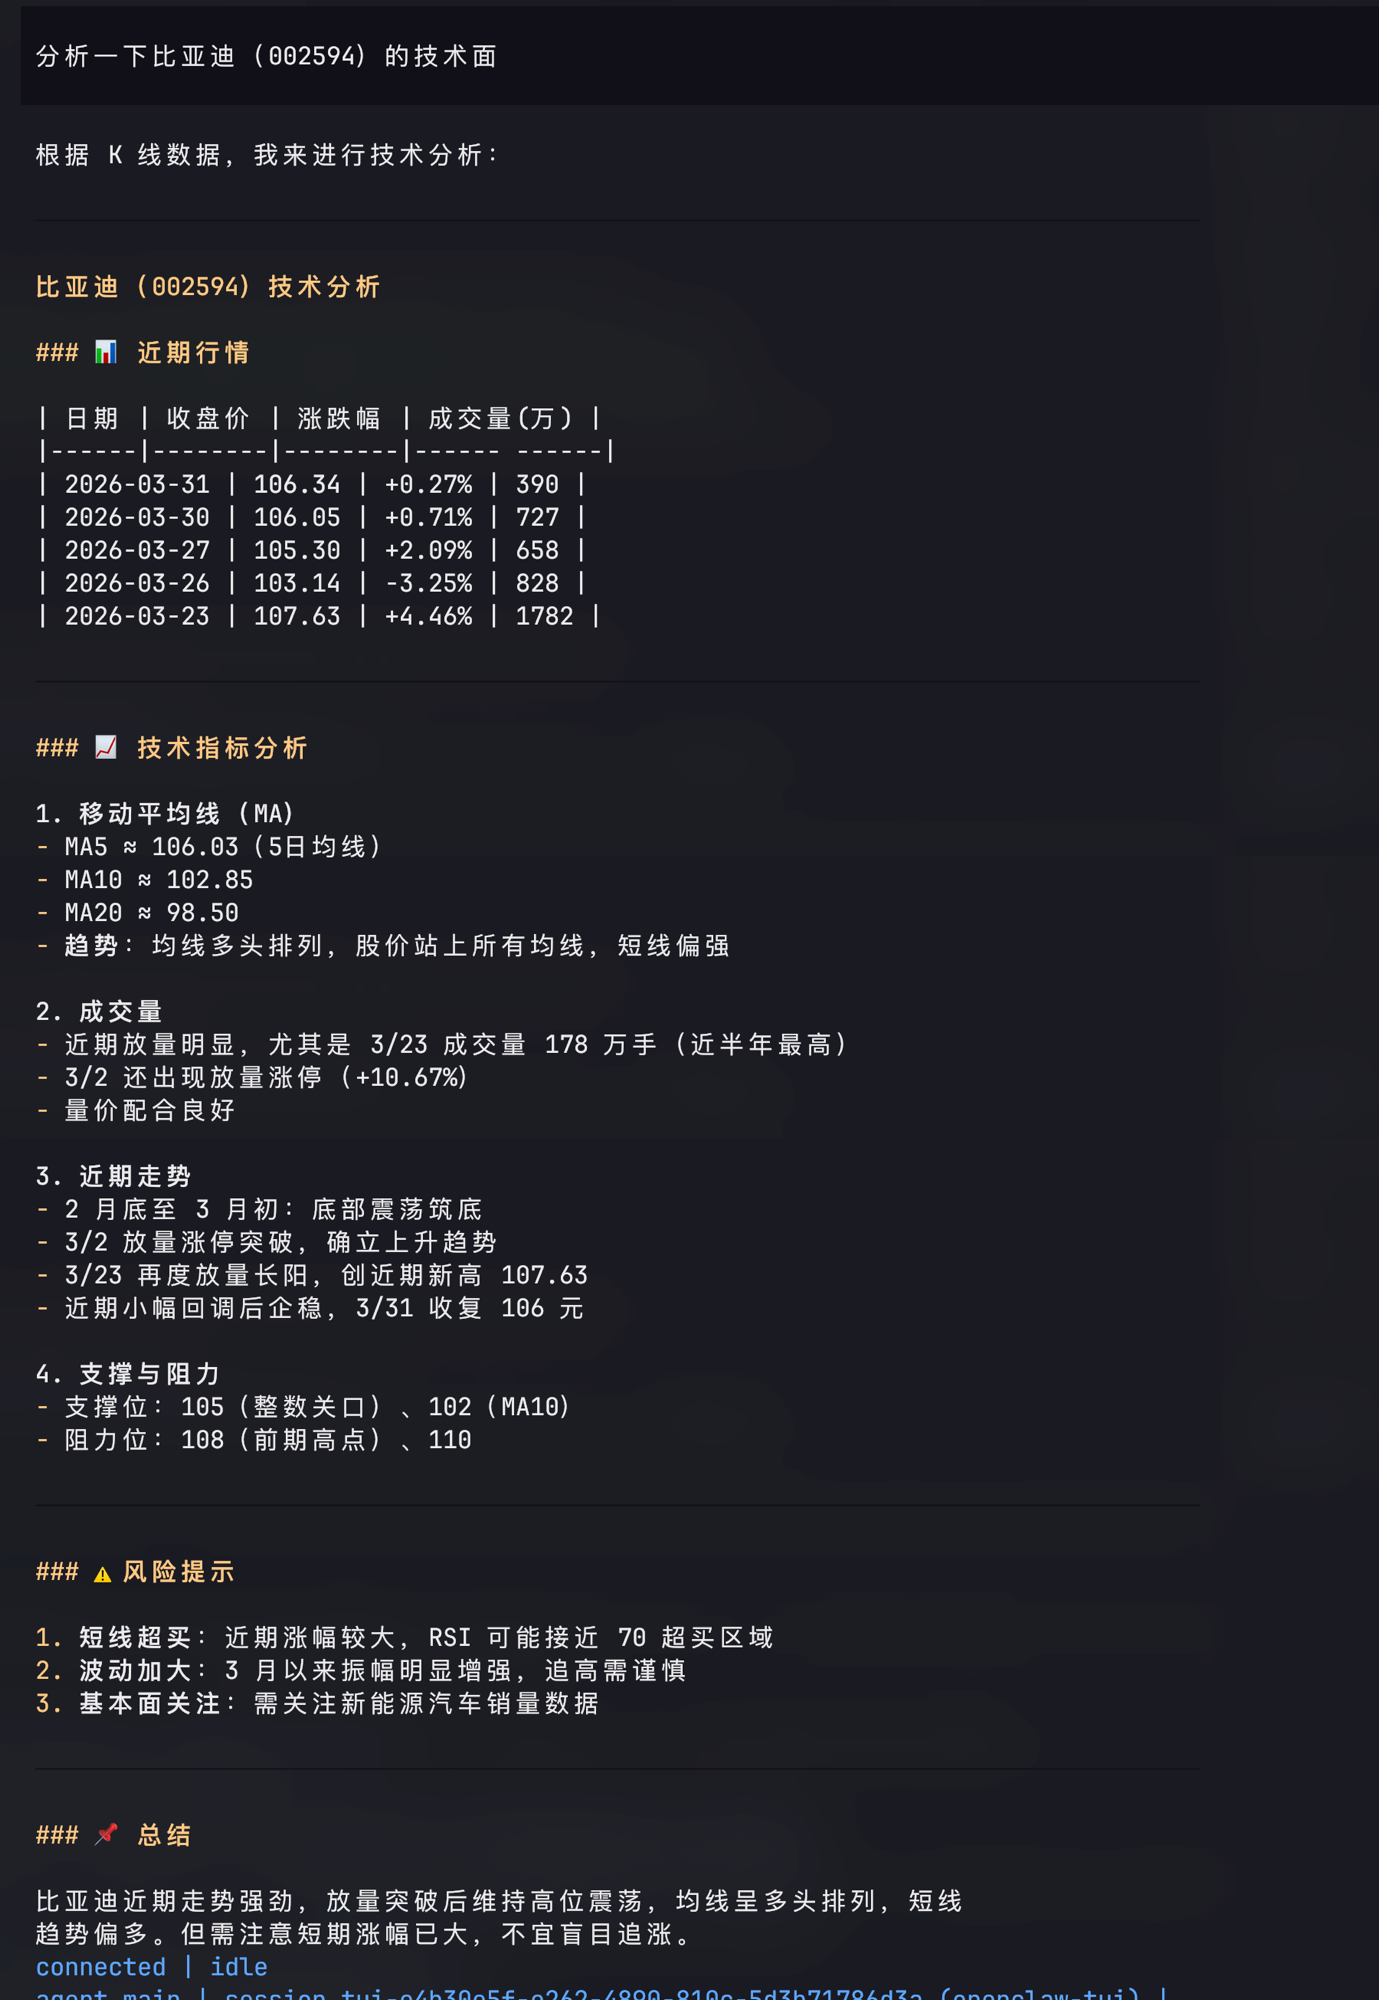
4. stock-screener — Market-Wide Stock Screener
Screen stocks from the entire market based on your specified criteria.
What it can do:
Market scope: Supports A-share full market, HK stocks, US stocks, or filter by index (CSI 300, ChiNext, etc.)
Price change filter: Today's gain greater than 5%, 5-day consecutive gains, etc.
Valuation filter: PE, PB below industry average, stocks trading below book value, etc.
Size filter: Market cap range (small-cap / mid-cap / large-cap)
Volume filter: Trading volume rankings, unusual turnover rates, etc.
Sorted output: Sort by specified metrics, output Top N results table
Example commands:
Find A-shares with today's gain over 5% and turnover rate above 3%
Screen consumer sector stocks with PE below 15 and market cap between 5-20 billion CNY
Which Hong Kong stocks have seen sudden volume spikes recently?
Help me find some undervalued bank stocks
Data Coverage
| Market | Description |
|---|---|
| A-shares | All stocks on Shanghai and Shenzhen exchanges, including STAR and ChiNext boards |
| HK stocks | Main board listed stocks on the Hong Kong Stock Exchange |
| US stocks | Major stocks on NYSE and NASDAQ |
Use Cases
Quick morning review of market sentiment before market opens
Daily watchlist tracking and portfolio management
Technical confirmation before short-term trades
Finding undervalued stocks for value investors
Tracking sector trends for thematic investors